Problem Title
How to sort the labels on the x-axis of a combo chart?
Problem Description
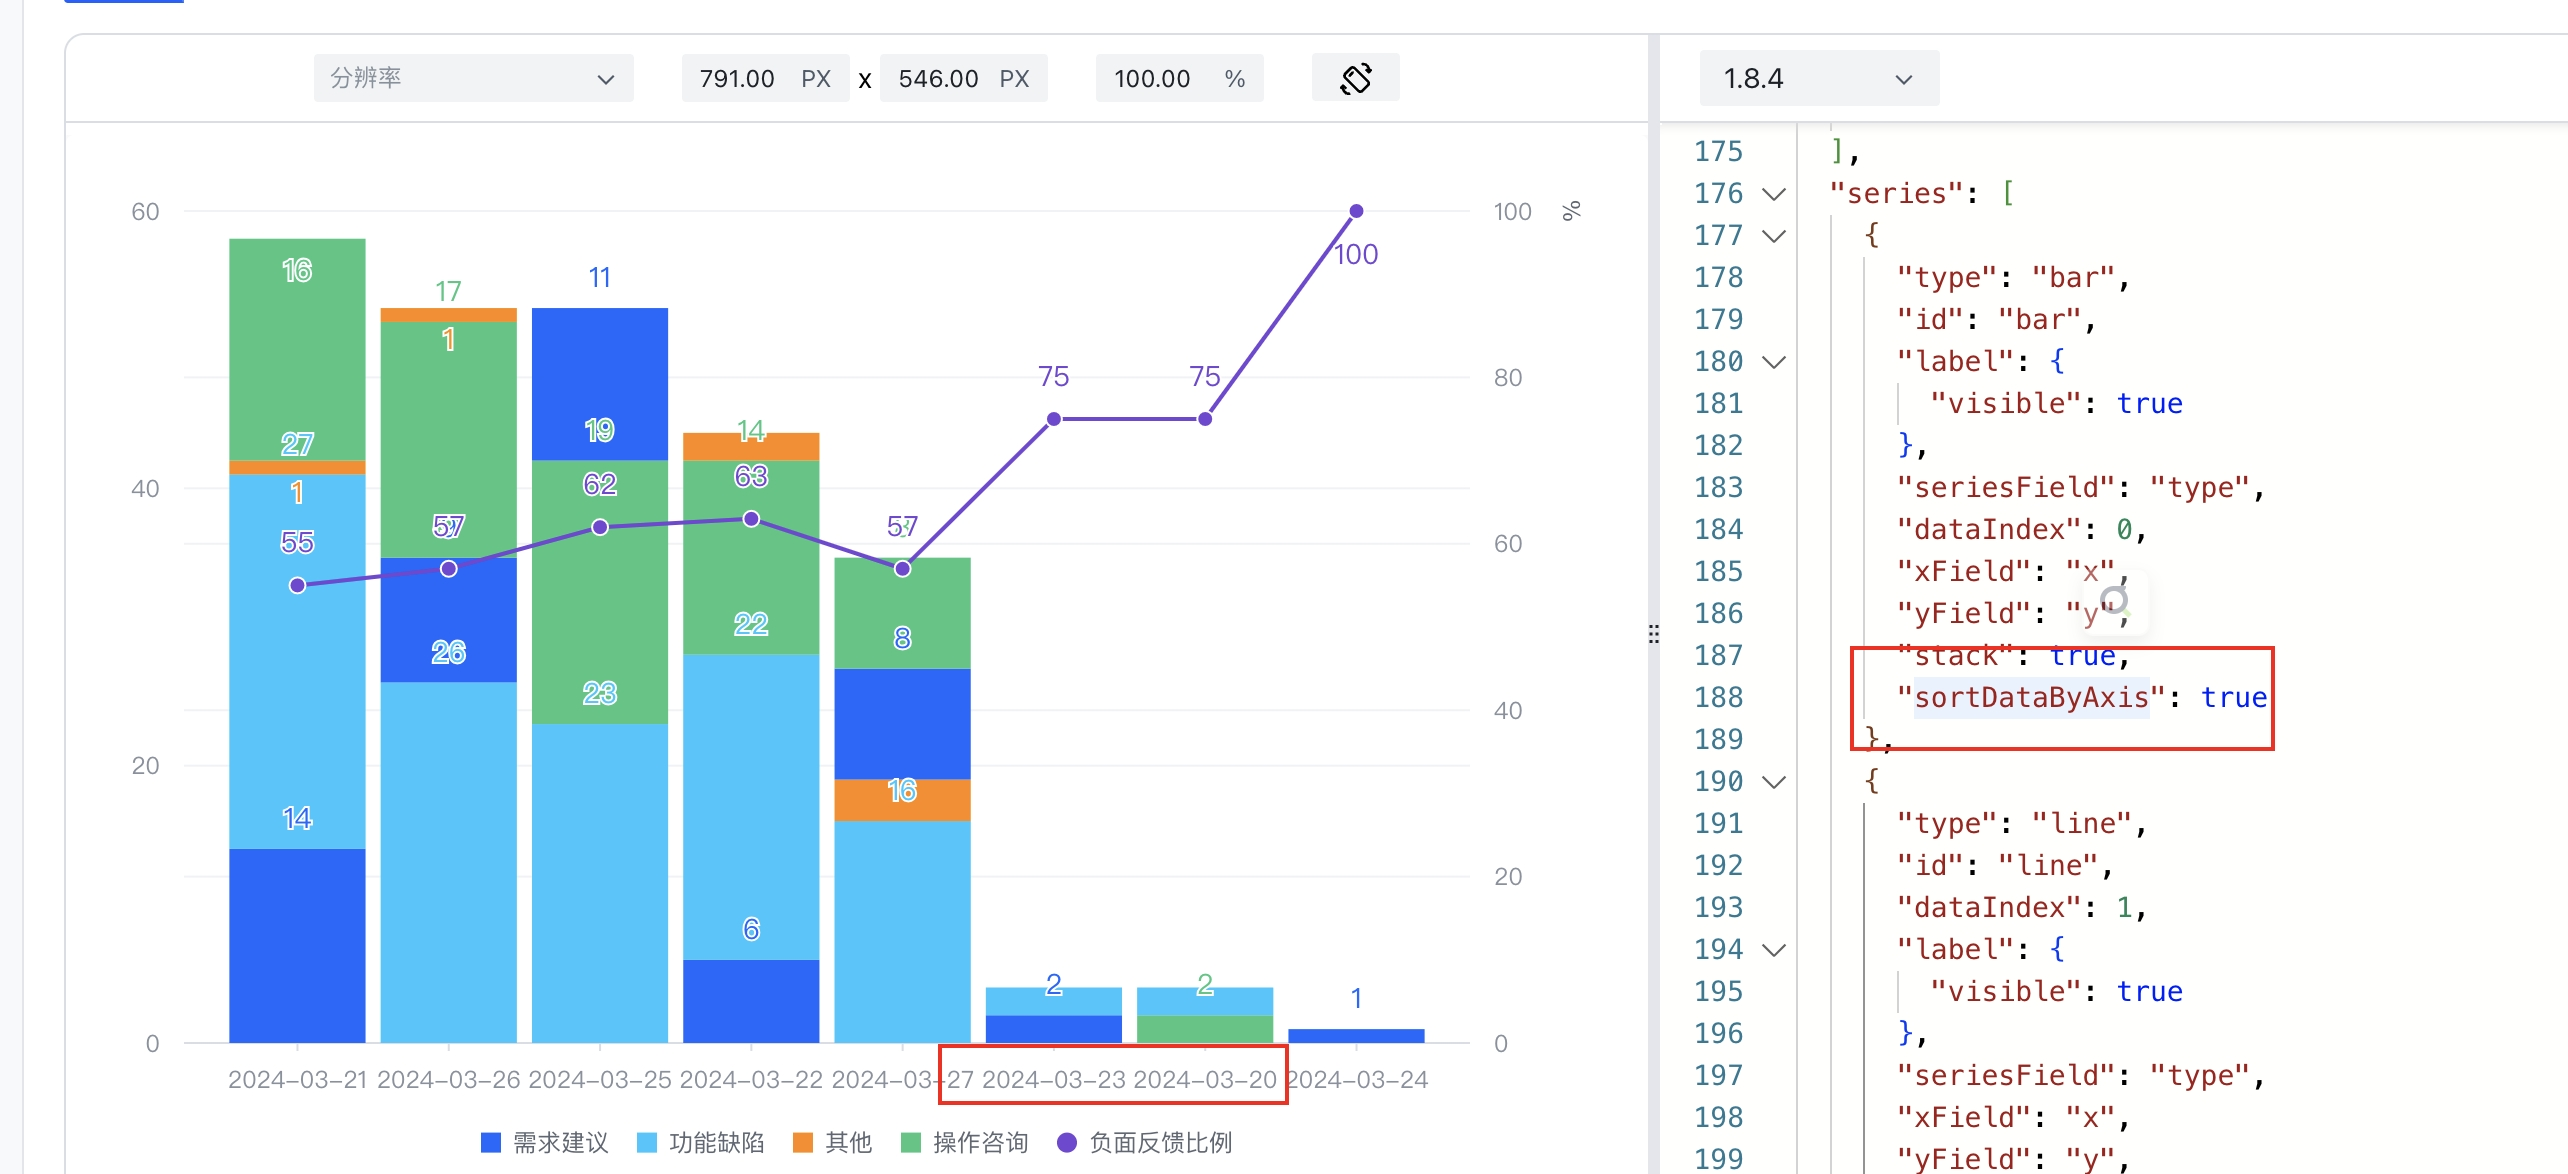
In the following combined chart, the x-axis labels are not sorted by time. Can the sorting effect be achieved through sortDataByAxis?

Solution
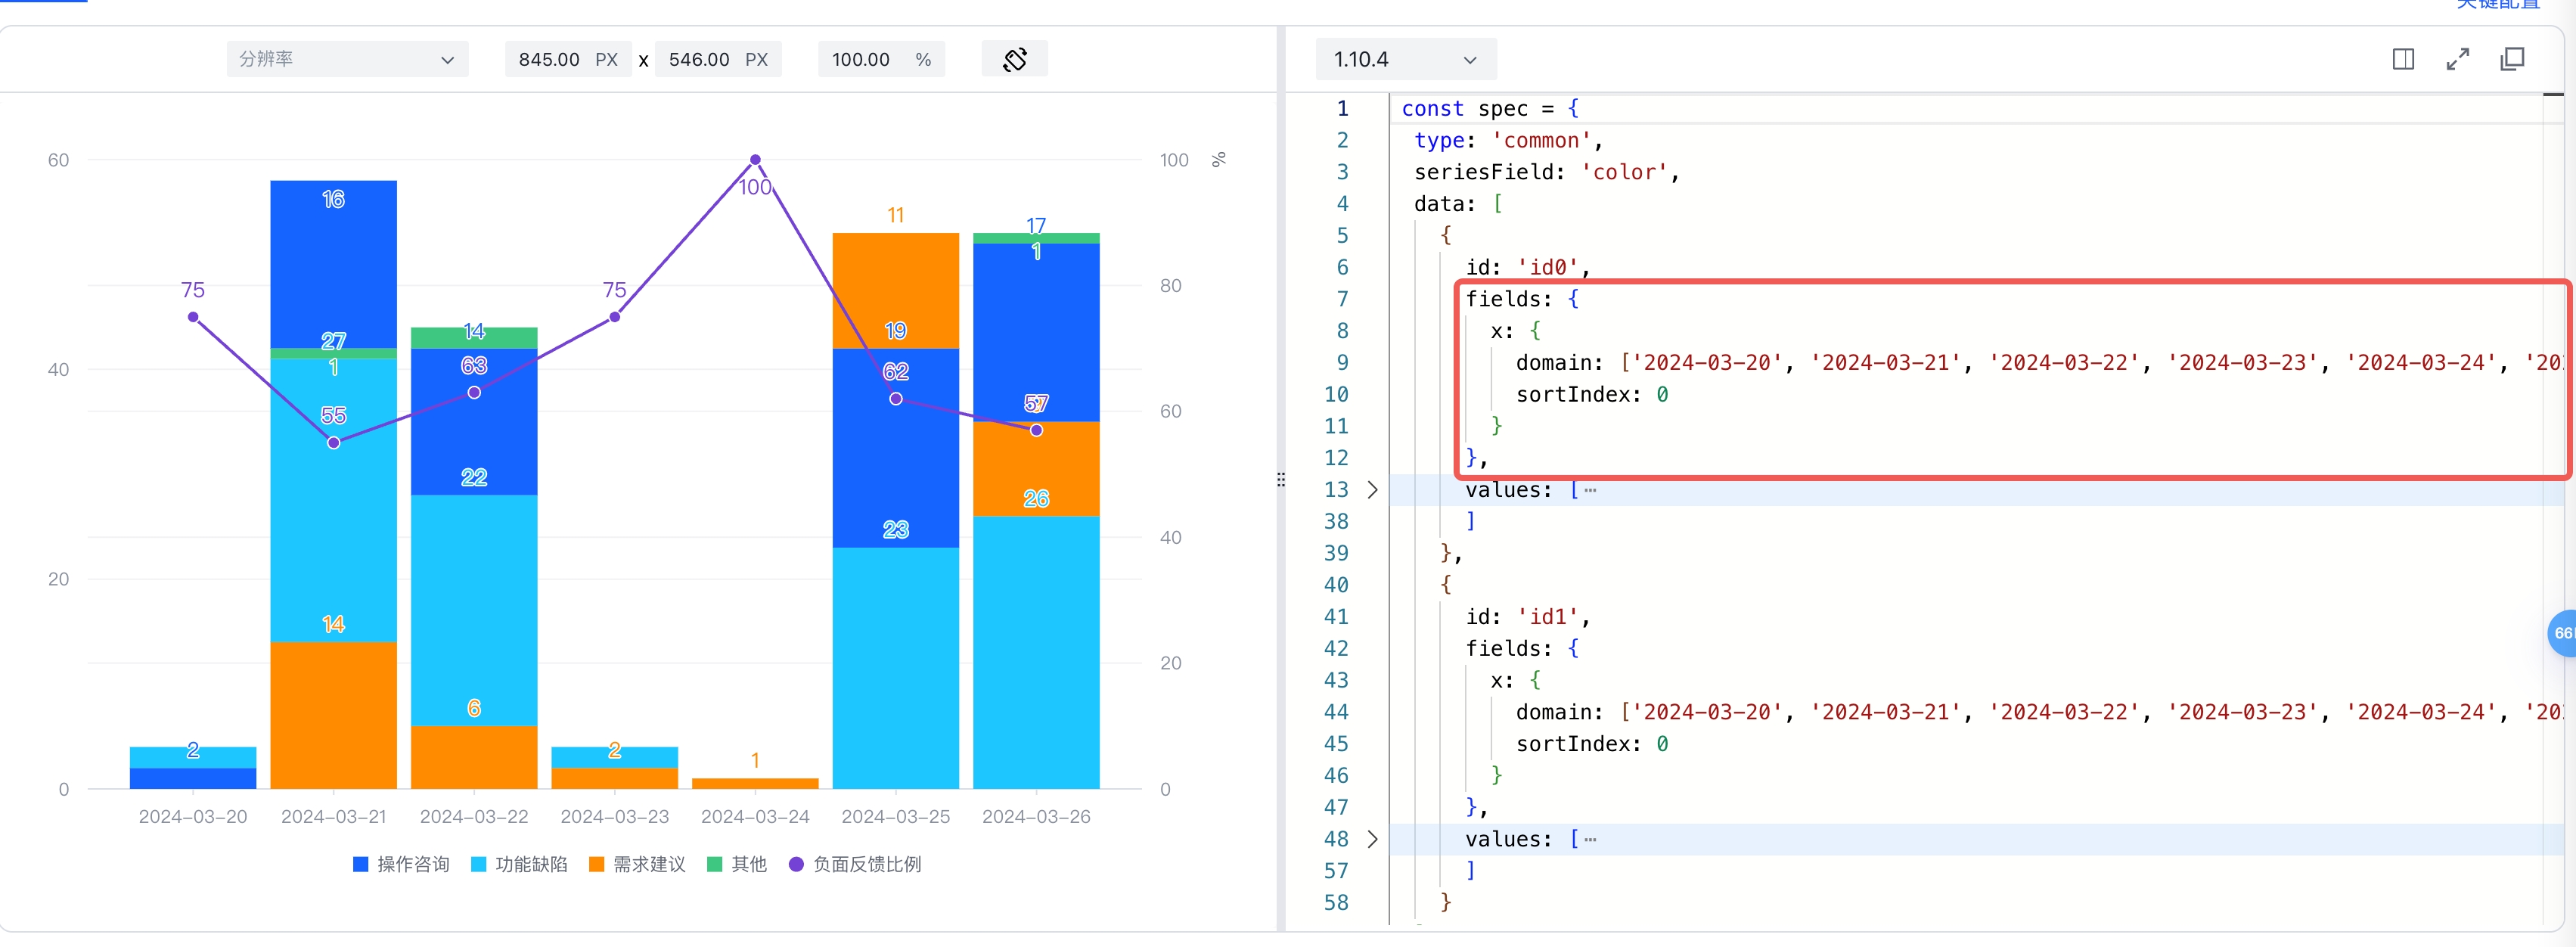
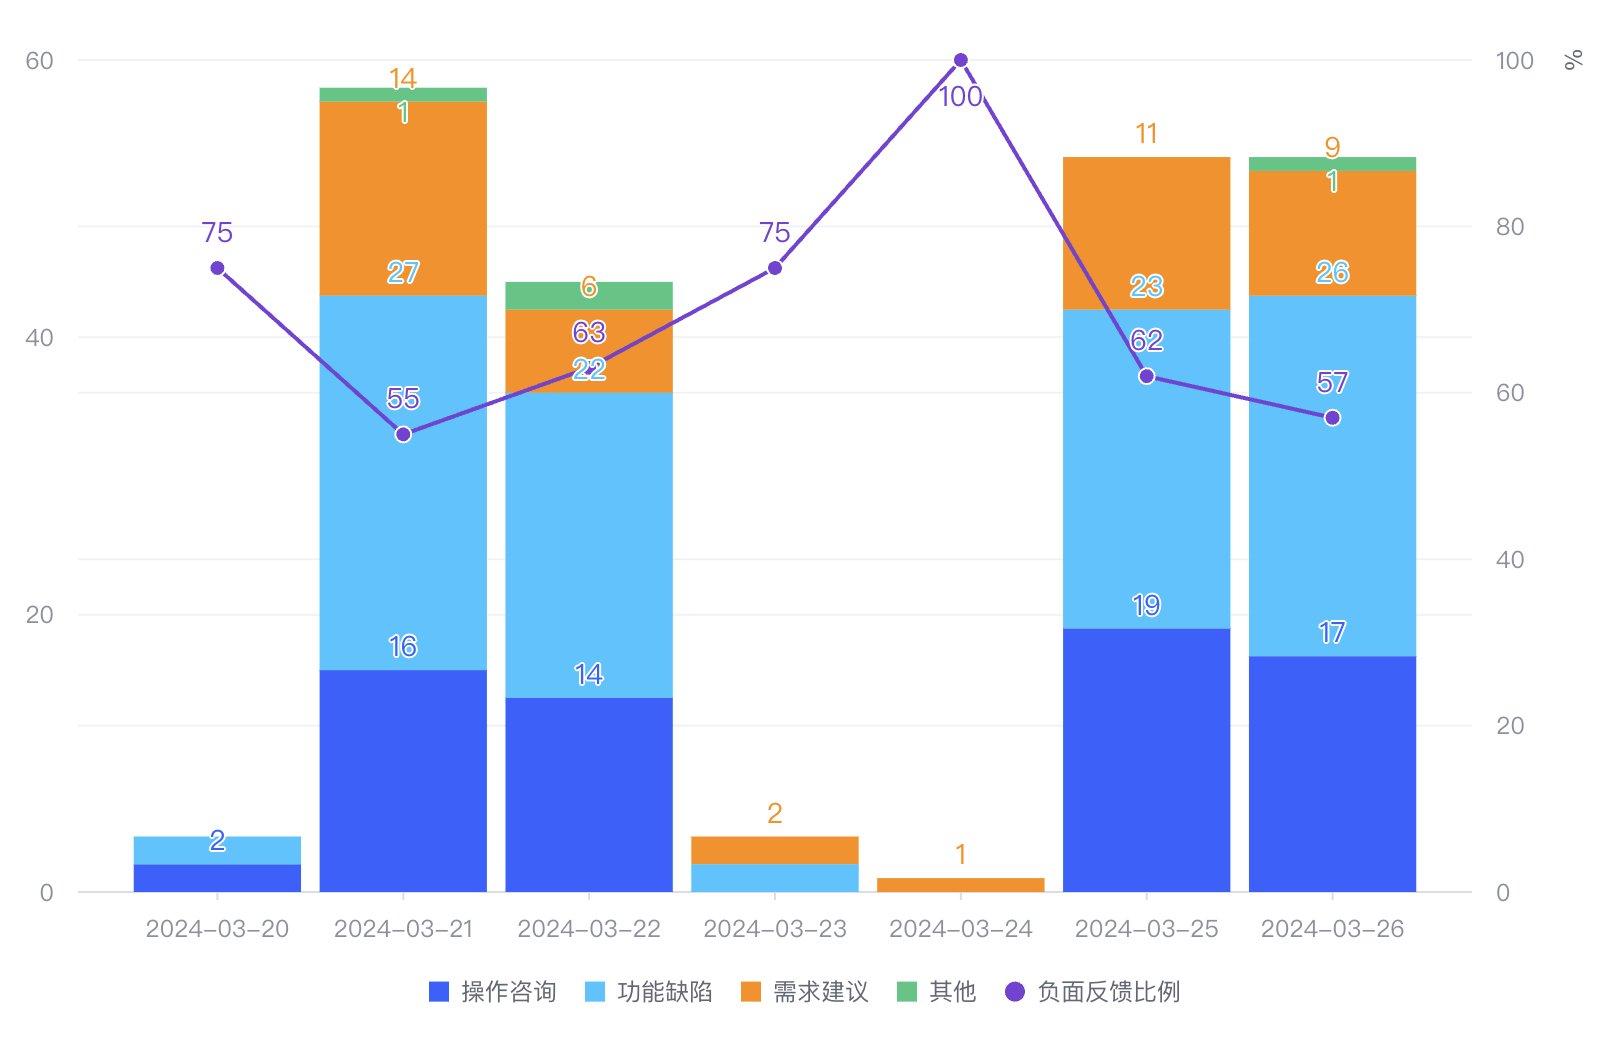
The function of sortDataByAxis is to sort the data of the series along the axis without affecting the sorting of the axis itself. To display the content on the axis in the desired order, there are two solutions:
-
Configure the fields in the data to set the domain order of the data to be displayed:

-
Sort the data in advance according to the display order.
Code Examples
const spec = {
  type: 'common',
  seriesField: 'color',
  data: [
    {
      id: 'id0',
      fields: {
        x: {
          domain: ['2024-03-20', '2024-03-21', '2024-03-22', '2024-03-23', '2024-03-24', '2024-03-25', '2024-03-26'],
          sortIndex: 0
        }
      },
      values: [
        { x: '2024-03-21', type: '需求建议', y: 14 },
        { x: '2024-03-21', type: '功能缺陷', y: 27 },
        { x: '2024-03-21', type: '其他', y: 1 },
        { x: '2024-03-21', type: '操作咨询', y: 16 },
        { x: '2024-03-26', type: '功能缺陷', y: 26 },
        { x: '2024-03-26', type: '需求建议', y: 9 },
        { x: '2024-03-26', type: '操作咨询', y: 17 },
        { x: '2024-03-26', type: '其他', y: 1 },
        { x: '2024-03-25', type: '功能缺陷', y: 23 },
        { x: '2024-03-25', type: '操作咨询', y: 19 },
        { x: '2024-03-25', type: '需求建议', y: 11 },
        { x: '2024-03-22', type: '需求建议', y: 6 },
        { x: '2024-03-22', type: '功能缺陷', y: 22 },
        { x: '2024-03-22', type: '操作咨询', y: 14 },
        { x: '2024-03-22', type: '其他', y: 2 },
        { x: '2024-03-27', type: '功能缺陷', y: 16 },
        { x: '2024-03-27', type: '其他', y: 3 },
        { x: '2024-03-27', type: '需求建议', y: 8 },
        { x: '2024-03-27', type: '操作咨询', y: 8 },
        { x: '2024-03-23', type: '需求建议', y: 2 },
        { x: '2024-03-23', type: '功能缺陷', y: 2 },
        { x: '2024-03-20', type: '操作咨询', y: 2 },
        { x: '2024-03-20', type: '功能缺陷', y: 2 },
        { x: '2024-03-24', type: '需求建议', y: 1 }
      ]
    },
    {
      id: 'id1',
      fields: {
        x: {
          domain: ['2024-03-20', '2024-03-21', '2024-03-22', '2024-03-23', '2024-03-24', '2024-03-25', '2024-03-26'],
          sortIndex: 0
        }
      },
      values: [
        { x: '2024-03-21', type: '负面反馈比例', y: 55 },
        { x: '2024-03-26', type: '负面反馈比例', y: 57 },
        { x: '2024-03-25', type: '负面反馈比例', y: 62 },
        { x: '2024-03-22', type: '负面反馈比例', y: 63 },
        { x: '2024-03-27', type: '负面反馈比例', y: 57 },
        { x: '2024-03-23', type: '负面反馈比例', y: 75 },
        { x: '2024-03-20', type: '负面反馈比例', y: 75 },
        { x: '2024-03-24', type: '负面反馈比例', y: 100 }
      ]
    }
  ],
  stackSort: true,
  series: [
    {
      type: 'bar',
      id: 'bar',
      label: { visible: true },
      seriesField: 'type',
      dataIndex: 0,
      xField: 'x',
      yField: 'y',
      stack: true,
    },
    {
      type: 'line',
      id: 'line',
      dataIndex: 1,
      label: { visible: true },
      seriesField: 'type',
      xField: 'x',
      yField: 'y',
      stack: false,
    }
  ],
  axes: [
    { orient: 'left', seriesIndex: [0] },
    {
      orient: 'right',
      seriesId: ['line'],
      gird: { visible: false },
      min: 0,
      max: 100,
      title: { visible: true, text: '%', position: 'start' }
    },
    { orient: 'bottom', label: { visible: true }, type: 'band' }
  ],
  legends: { visible: true, orient: 'bottom' }
};</br>
Result Presentation

